





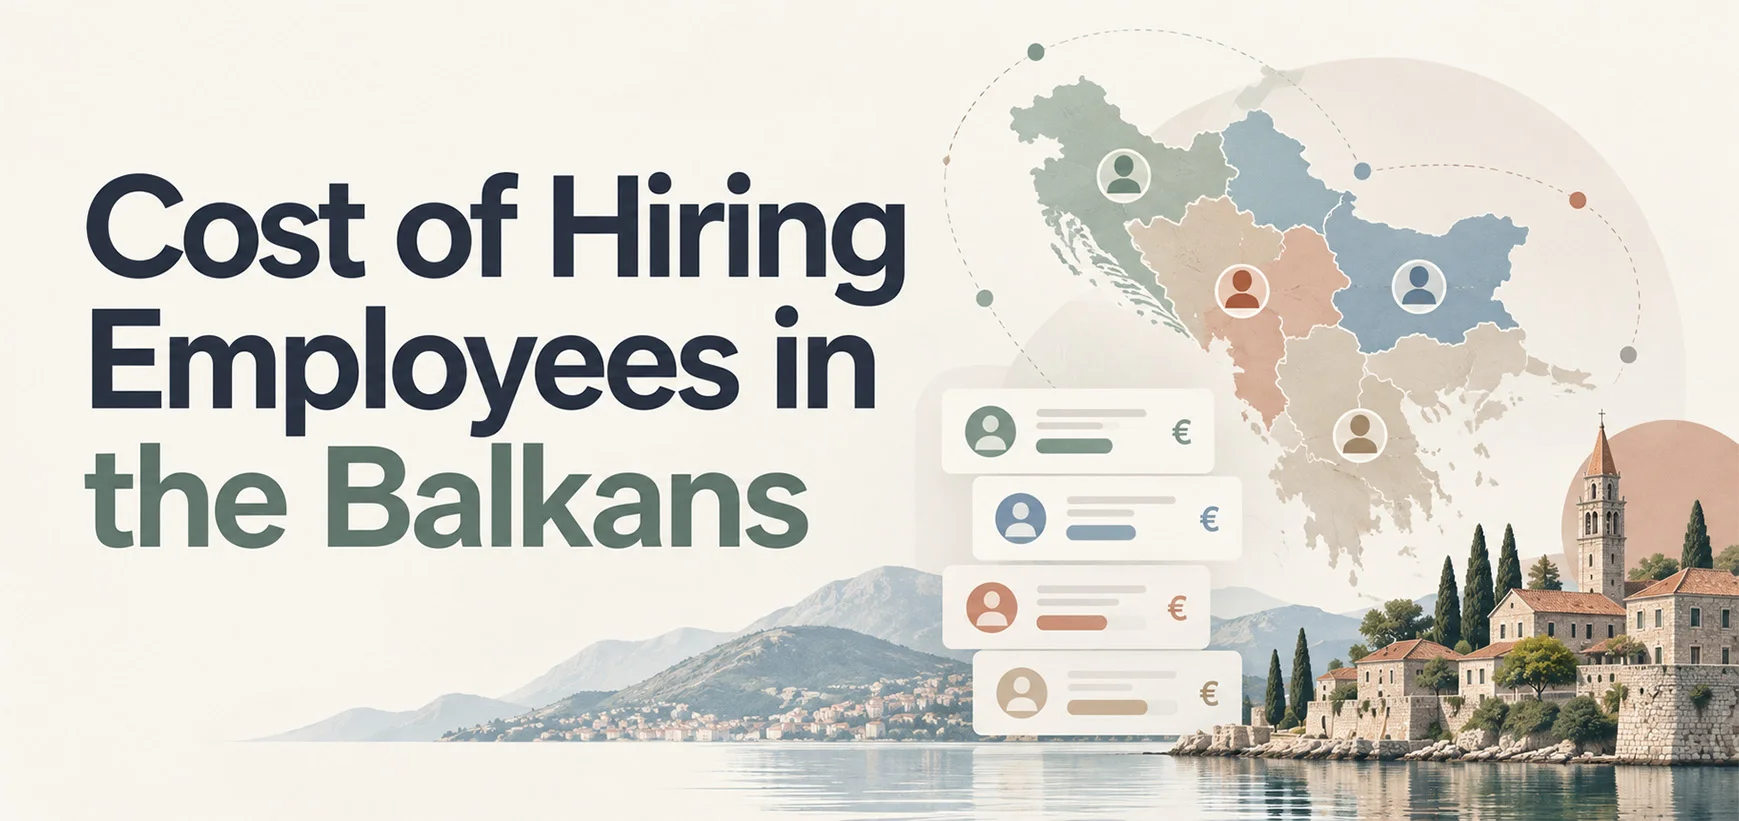
What does an employee really cost in Albania, Serbia, North Macedonia, Montenegro, Bosnia & Herzegovina, Bulgaria, Romania and Croatia?
Last updated: August 2026
Hiring in the Balkans can look inexpensive when you compare salaries with Western Europe, but gross salary is only part of the cost. Employer social contributions, health insurance and the way each country structures payroll can change what a business actually pays.
For founders, the useful question is simple: where can you build the team you need at a cost the business can sustain?
We compared eight Balkan markets using the latest available wage and payroll data, with the main figures shown in euros for easier comparison.
Hiring Costs Across the Balkans
| Country | Approx. Gross Wage / Month | Employer-Side Contributions | Indicative Direct Employer Cost* | EU |
| 🇦🇱 Albania | ~€895 | 16.7% | ~€1,045 | No |
| 🇲🇰 North Macedonia | ~€1,050 | Mainly within gross salary | ~€1,050† | No |
| 🇲🇪 Montenegro | ~€1,220 | Low employer-side burden | ~€1,225 | No |
| 🇧🇦 Bosnia & Herzegovina | ~€1,260 | Varies by entity | Entity-specific | No |
| 🇧🇬 Bulgaria | ~€1,330 | ~18.9–19.6% | ~€1,585 | Yes |
| 🇷🇸 Serbia | ~€1,450 | 15.15% | ~€1,670 | No |
| 🇷🇴 Romania | ~€1,940 | ~2.25% in normal conditions | ~€1,985 | Yes |
| 🇭🇷 Croatia | ~€2,010 | 16.5% | ~€2,340 | Yes |
*Simplified illustrations based on average gross wages and standard employer-side payroll charges. Actual costs vary by salary level, contribution ceilings, sector, benefits and employment structure.
†North Macedonia works differently from a simple gross-salary-plus-employer-tax model. Its compulsory contributions are largely withheld within gross salary rather than added as a full extra employer charge. (taxsummaries.pwc.com)

Which Countries Should You Shortlist?
| Your Priority | Best Markets to Investigate |
| Lowest indicative payroll | 🇦🇱 Albania / 🇲🇰 North Macedonia |
| Low-cost EU hiring base | 🇧🇬 Bulgaria / 🇷🇴 Romania |
| Tech & engineering scale | 🇷🇸 Serbia / 🇷🇴 Romania / 🇧🇬 Bulgaria |
| Customer support/services | 🇦🇱 Albania / 🇲🇰 North Macedonia |
| Larger future team | 🇷🇸 Serbia / 🇷🇴 Romania |
| Euro-area base | 🇭🇷 Croatia |
The important point is that the cheapest does not always mean best. A lower-cost market only works if you can find the skills, languages and seniority your business actually needs.
What Could a 20-Person Team Cost?
| Country | Approx. Monthly Cost for 20 Employees | Approx. Annual Direct Payroll |
| 🇦🇱 Albania | ~€20,900 | ~€251,000 |
| 🇲🇰 North Macedonia | ~€21,000 | ~€252,000 |
| 🇲🇪 Montenegro | ~€24,500 | ~€294,000 |
| 🇧🇬 Bulgaria | ~€31,700 | ~€380,000 |
| 🇷🇸 Serbia | ~€33,400 | ~€401,000 |
| 🇷🇴 Romania | ~€39,700 | ~€476,000 |
| 🇭🇷 Croatia | ~€46,800 | ~€562,000 |
| 🇧🇦 Bosnia & Herzegovina | Entity-specific | Entity-specific |
These figures assume employees earn around the national average, so they are budgeting indicators rather than hiring quotations.
Even so, the difference is meaningful. On this simplified model, a 20-person team in Albania could cost more than €300,000 less per year in direct payroll than the same-sized team in Croatia.
That saving matters only if the lower-cost market can support the team you need.
What Each Market Is Best For
Albania offers one of the leanest payroll bases in the comparison and can work well for customer support, agencies, tourism and internationally delivered services. Its biggest question is talent depth for specialist roles.
North Macedonia is also cost-competitive and can suit lean, export-oriented operations. The founders must study its payroll model thoroughly without just comparing headline contribution rates.
Serbia may be expensive, but the key reason behind it is the size. The greater use of technology, engineering, and teams may explain its more expensive payroll if access to better specialists is more important than cheaper salaries.
Bulgaria may be the best choice for companies that aim for lower labour costs while staying in the EU. Eurostat stated an average hourly labour cost of €12.0 in 2025, being the lowest in the EU. (ec.europa.eu)
Romania combines a larger labour market with relatively competitive EU labour costs. It is worth considering for tech, shared services and companies expecting larger headcount.
Croatia is more expensive, but offers an EU and euro-area base. Its value is therefore less about cheap labour and more about operating requirements and market access.
Croatia is more costly, but has an EU and euro-area basis. Thus, its advantages are not related to cheap labor but rather to operational needs. The founders who are interested in working in this country can consider the full set of pros and cons of doing business in Croatia.
Montenegro has a relatively light employer-side payroll burden, although average wages are already above Albania and North Macedonia.
Bosnia & Herzegovina needs location-specific modelling because payroll rules differ between the Federation, Republika Srpska and Brčko District.
Hiring Developers? Do Not Rely on Average Salaries
National averages are useful for creating a shortlist, but they become much less useful when you hire developers, engineers, senior salespeople or experienced managers.
For specialist hiring, compare the actual salary range for the role, add employer contributions, and then consider recruitment time and retention. A country with a lower average salary is not automatically cheaper if the talent you need is difficult to find.
The better question is:
Where can we build the right team at a sustainable total cost?
Where Should You Hire in the Balkans?
For lean service and support teams, start with Albania and North Macedonia.
For a low-cost EU hiring base, Bulgaria is particularly strong, while Romania becomes more attractive when you need greater scale.
For technology, engineering and larger future teams, Serbia deserves serious consideration even though average payroll is higher.
For an EU and euro-area employment base, Croatia offers a different strategic advantage.
There is no universal winner. The strongest hiring market is the one where salary, employer taxes, talent availability and future headcount work together for your business.
Methodology
KOLEKR Insights reviewed the latest information available as of August 2026, using official national statistical offices, Eurostat and PwC Worldwide Tax Summaries.
All major figures are shown in euros for easier comparison. Local-currency wage figures are approximate conversions and rounded to avoid false precision.
Gross salary, employer contributions and total labour cost are different measures. The employer-cost figures above are simplified illustrations and should be validated with a local payroll or accounting adviser before making hiring decisions.